Anomaly Tracking Dashboard
UI/UX Design
Web Design
Dashboard
Anomaly Tracking Dashboard
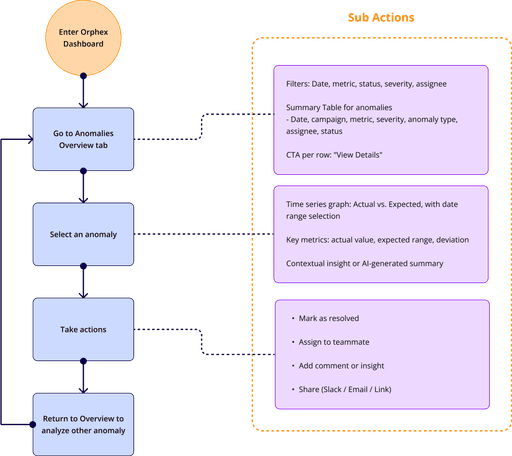
The interface highlights two key sections: Overview and Detail View, each tailored for specific use cases.
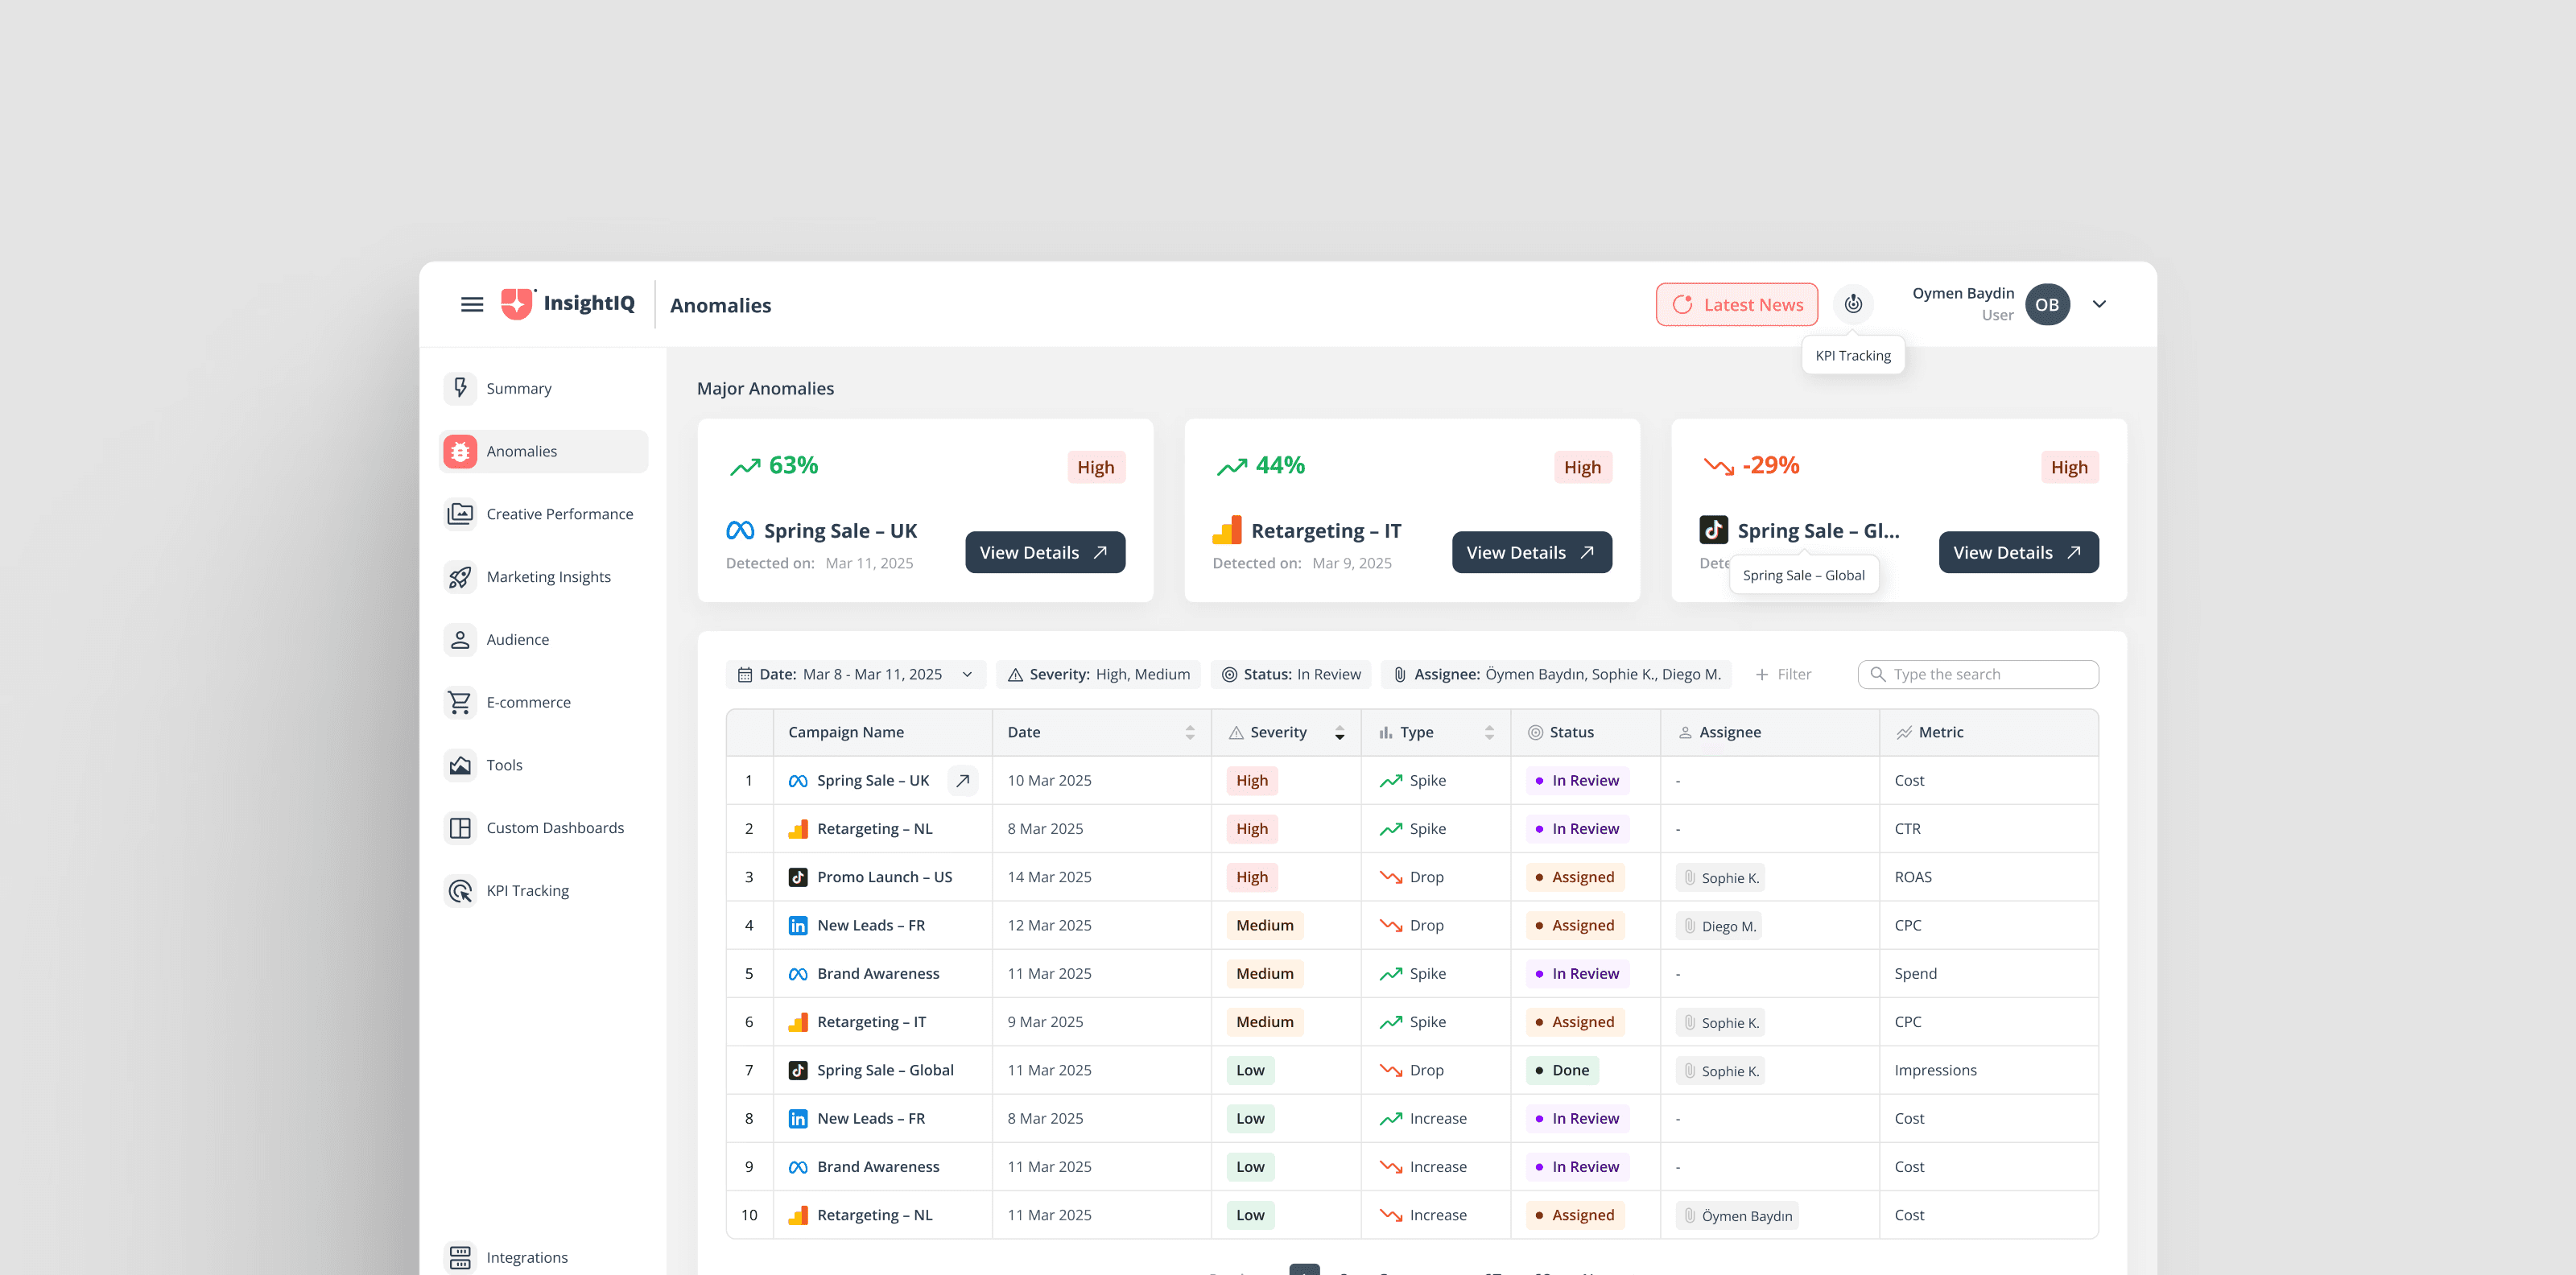
Overview
A consolidated view of ongoing campaigns with severity indicators, allowing users to quickly identify critical anomalies.
Detail View
Detailed insights on each anomaly, including metric analysis, deviation percentages, and actionable suggestions.
Here’s a fresh take on a campaign anomaly tracking dashboard, designed to streamline data analysis for marketing teams
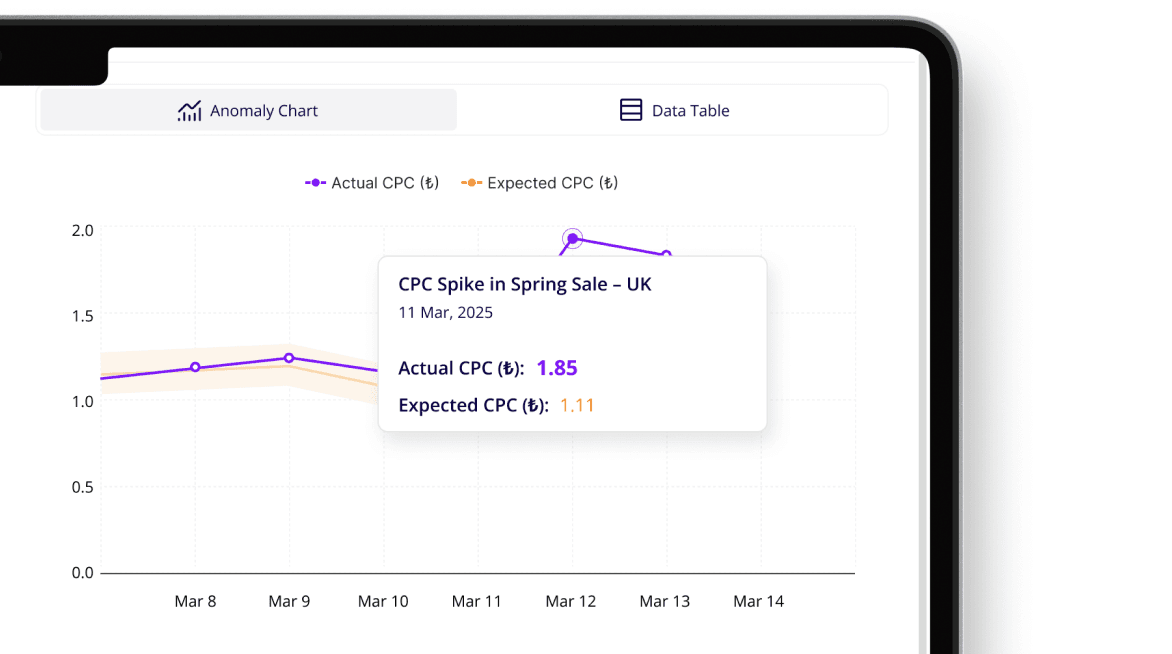
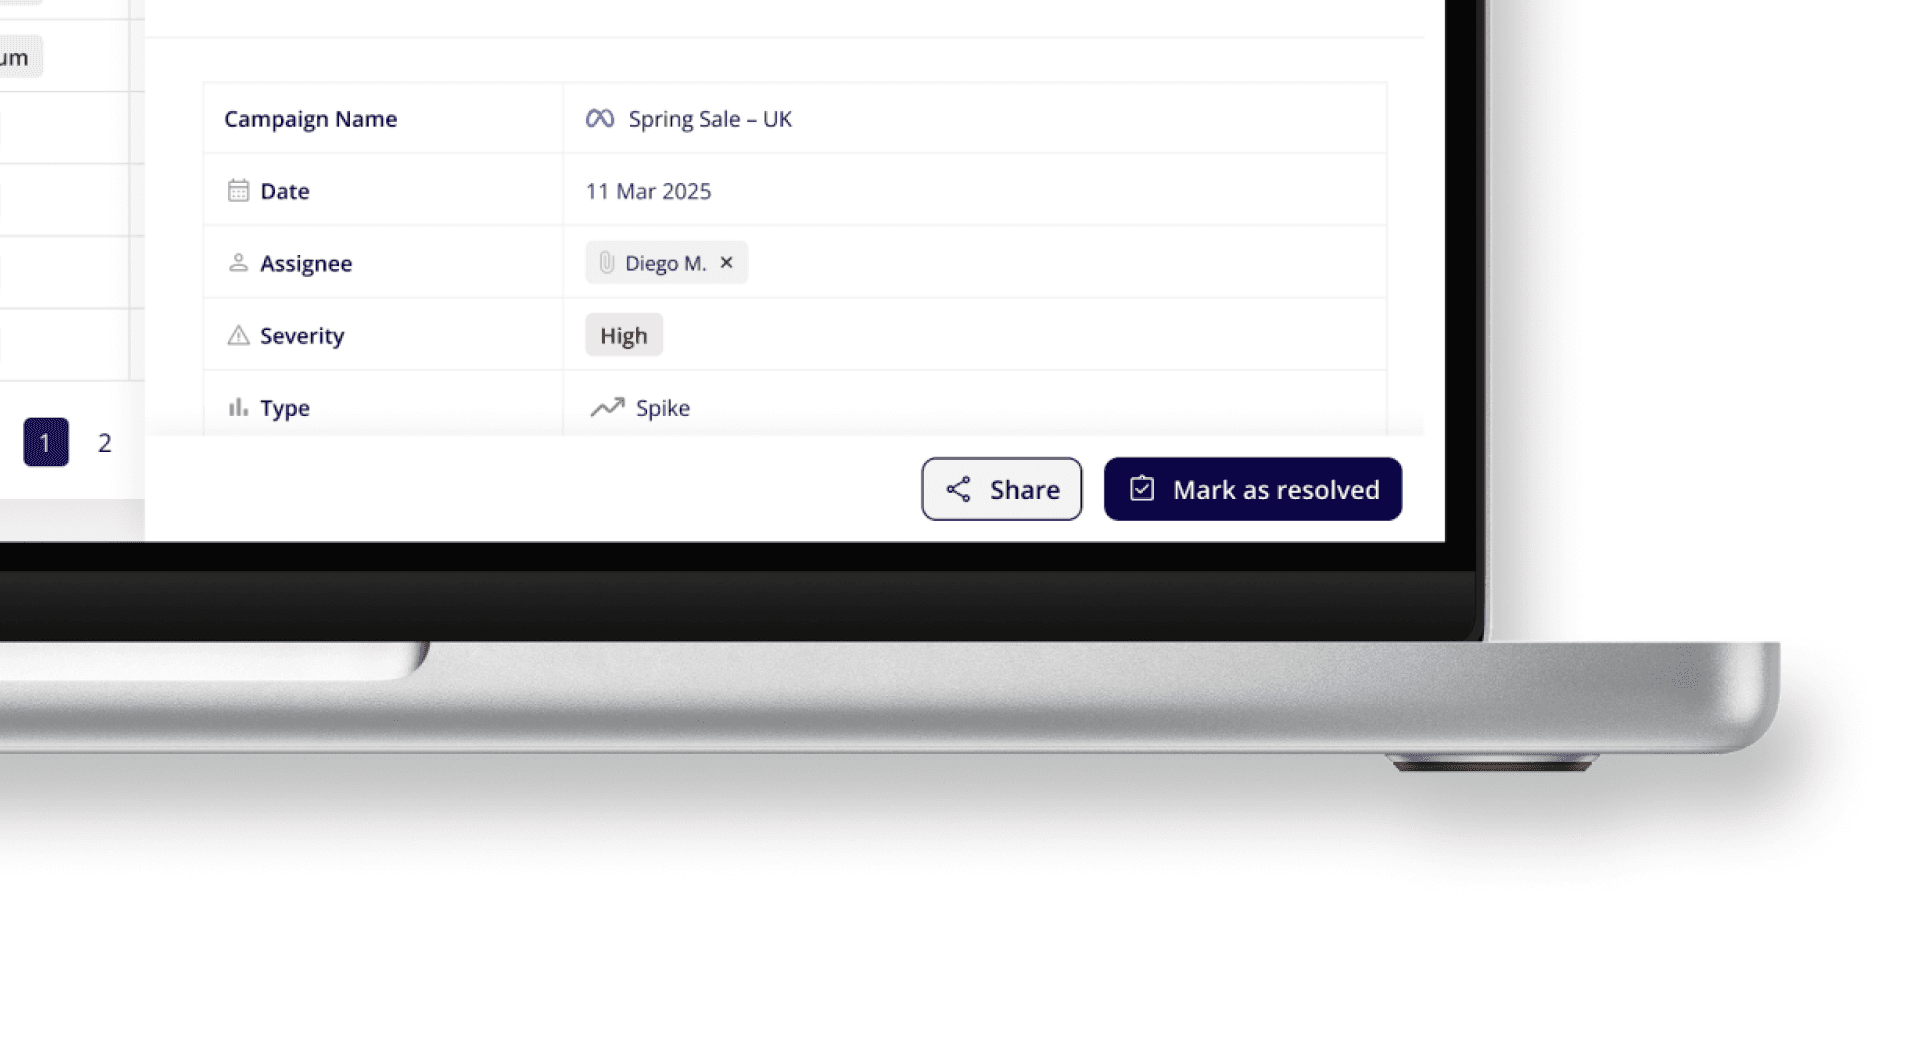
Anomaly Detail Page
Anomaly summary panel: metric, deviation %, detected date, etc.
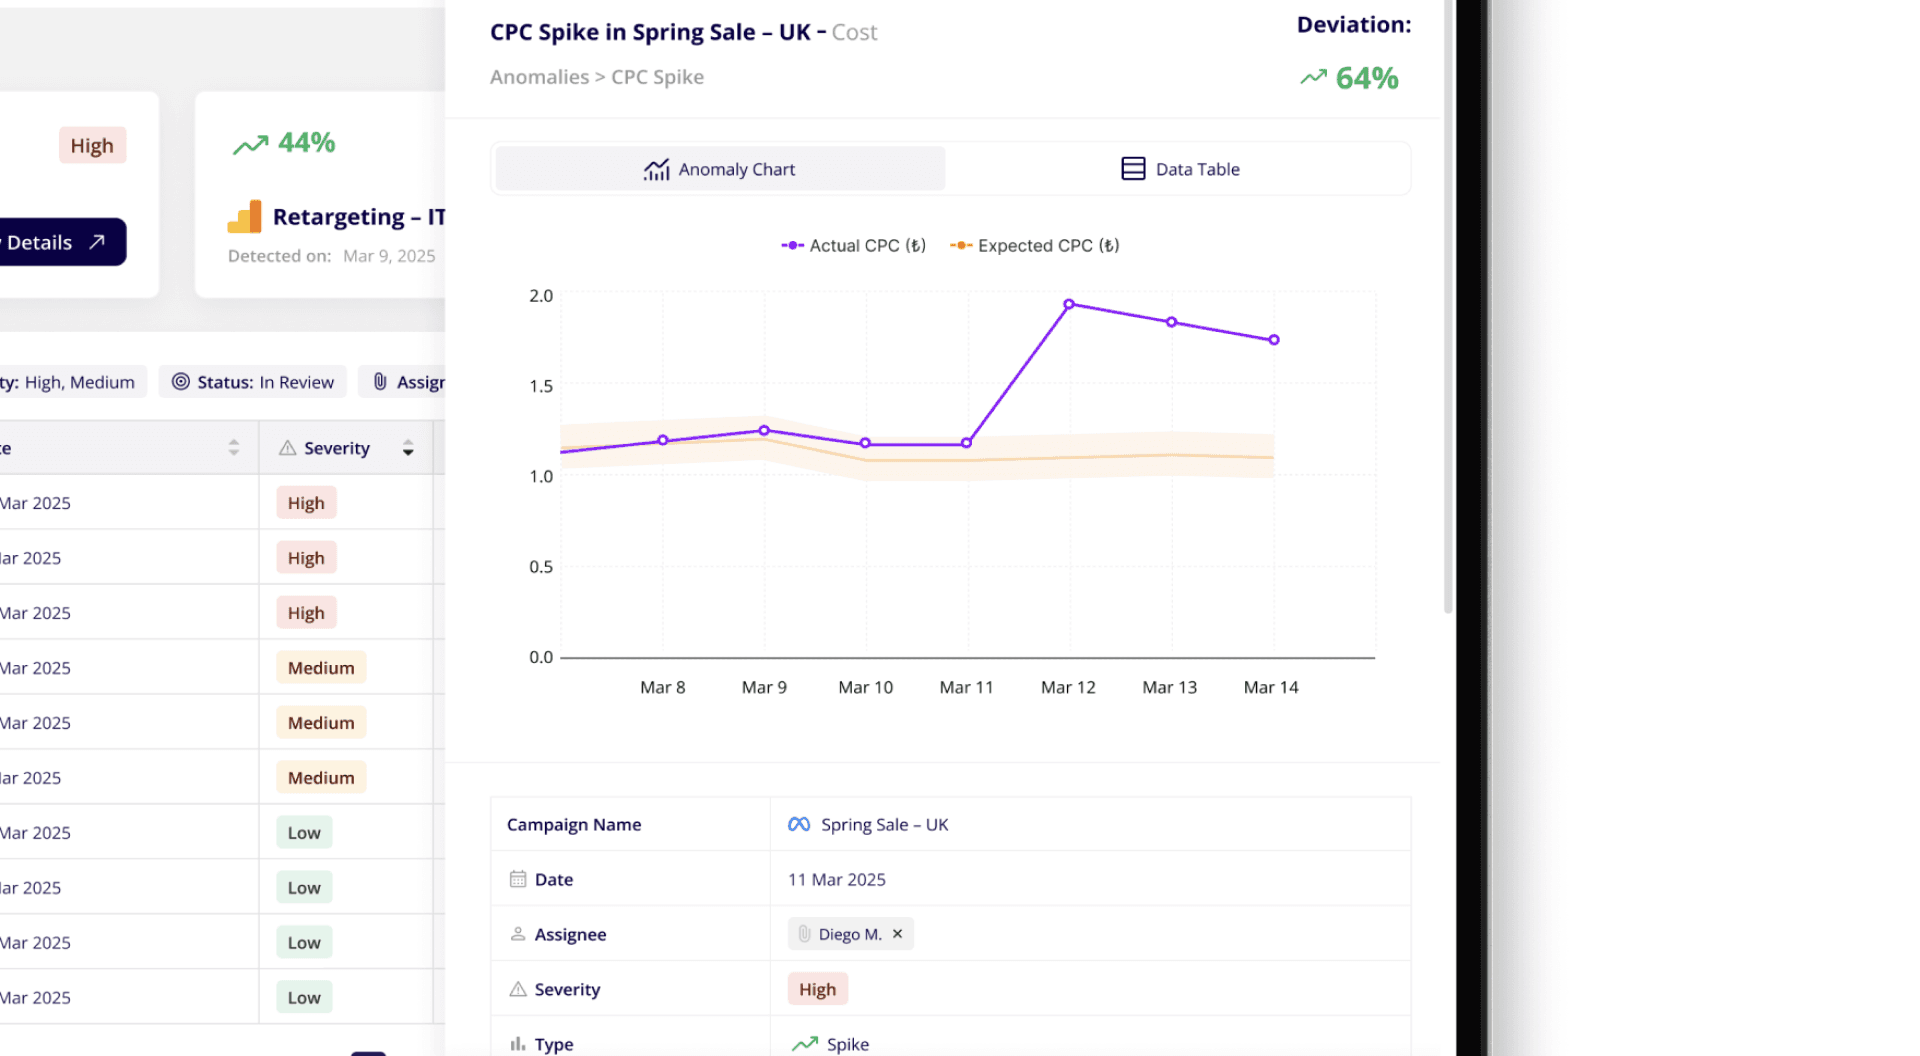
Action panel: Mark as Resolved, Assign to Teammate, Share Insight
Actual vs Expected line chart and insight box with contextual copy